


iShares MSCI World Value [IWVL/IWFV]
Good value?

Next up, a look into an equity sector which has experienced somewhat of a renaissance over the past six months following many years of (relative) underperformance against popular growth stocks.
Often, the stock investing universe is simplistically divided into two camps: ‘Value’ and ‘Growth’ companies.
Investors occasionally define their investing styles as following one or the other, but in practice we’re aiming for a combination of both - trying to find growing companies at a price we believe is good value.
Generally when people refer to ‘Value’ stocks, they are suggesting that by some traditional valuation metric - Price/Earnings, Price/Book, Dividend Yield etc - the stock or sector in question is deemed to be good value against a wider market metric.
For example, if the FTSE 100 trades on a price/earnings ratio of, say, 20 (i.e. the average P/E across all stocks in the index is 20) but a certain stock is valued on a P/E of 10 then we might consider the stock to be undervalued compared to the general index.
This is just one example, and there are various metrics to consider and comparatives across sectors, countries and durations. It is also key to consider why a particular company or sector trades at a 'lower’ value than its peers or more richly valued sectors.
So, what ETFs offer exposure to ‘value’ stocks? Well, as you may have guessed from the title, this post introduces the iShares World Value Factor ETF which at just over £3bn of asset value makes it the largest value focused ETF on the European market.
What’s in it?
Taking a closer look at the official blurb reveals that…
The Fund seeks to track the performance of an index composed of a sub-set of MSCI World stocks that capture undervalued stocks relative to their fundamentals.
Digging deeper, we find that the fund aims to replicate the performance of the MSCI World Enhanced Value Index, and that this index is comprised of stocks from across the ‘Developed’ world based on three equal factors:
These are fairly technical fundamental ways of analysing companies.
The first factor takes the share price of the company and divides it by the expected earnings per share (EPS) for the next year.
As a rule, most mature companies historically have operated on a P/E ratio of between 15 and 25, although this does fluctuate depending on the economic enviroment (bubble or bust?) and factors such as the general level of interest rates. It’s worth exploring the historical ratios to see how the market moves over time.
The second factor takes the share price and divides it by the Book Value per Share which is basically total assets minus liabilities divided by shares outstanding.
This method is much more effective for companies which have more tangible assets - i.e. factories, machinery, physical goods etc - rather than digital companies whose assets are mostly intangible - i.e. intellectual property, network effects etc, which is why Price/Book is less of an important metric in today’s investing environment than it traditionally was.
Finally, the mouthful of a metric which is EV/CFFO measures the ratio of Enterprise Value (Market Capitalisation minus Net Debt) to the Cash Flow from Operations (basically a measure of how much cash flow the company generates from its day-to-day operations excluding things like capital expenditures or interest payments).
The aim here is to have a low ratio (lots of cash, low market company value) as it indicates a company may be undervalued compared to the cash it is generating.
These indicators are quite technical and subjective, but we’re not trying to calculate these ourselves - we just need to be aware that is how the index selects the stocks and weightings within it.
Value Traps
One key risk we need to be aware of is that metrics which recommend a stock for this specific index may mean that the company is a ‘value trap’. These are effectively companies which are cheap for a good reason - they are terrible companies or in declining industries.
Ever seen a deal which was too good to be true? This index will no doubt contain some examples of the equity equivalent.
Composition
Being a ‘World’ tracker means just that - stocks are selected from a basket of eligible MSCI World stocks. A breakdown by country/region as of the 15th March 2021:

As you can see, and unsurprisingly, a large chunk of the companies are based in the USA (41%), with Europe (EU plus UK, Switzerland & Norway) comprising of a further 29%. Japan adds a further 26%, with the remainder split amongst other developed world markets.
Note there is no exposure to mainland Chinese stocks (Hong Kong listed companies not withstanding), nor is there any contribution from Emerging Markets - this is because the Index focuses on ‘Developed’ markets (a term which becomes less meaningful every passing year).
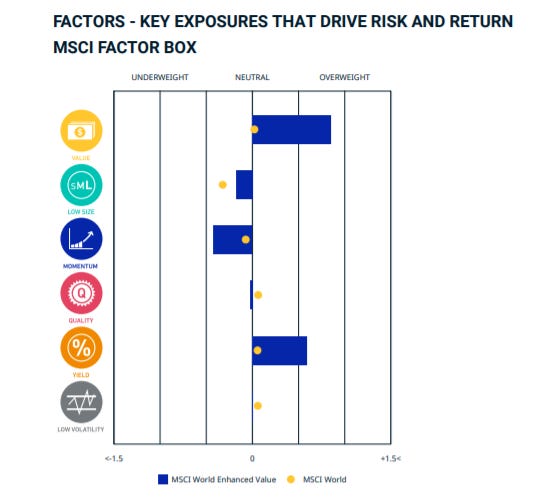
The following nifty chart from MSCI shows where the Value Index compares vs. the standard World index1:
Holdings
As of the 15th March 2021, the top ten holdings (inc. cash) were as follows:

Some well known ‘blue chip’ companies here, but (perhaps with the exception of Softbank) it would be difficult to define any of these as growing aggressively in any meaningful sense.
The main sectors which are held include:

Surprised to see IT so heavily represented here, given that ‘tech’ is usually considered a growth industry? Well this does contain high exposure to mature semiconductor and IT equipment makers such as Intel, Broadcom, Hitachi and Cisco who are key constituents of the digital world we live in, but are also mature companies in an industry which has slow and steady growth (Cisco would not have been part of this Value Index in 1999!).
Financials, including banks such as Citigroup are the second largest weighting, followed by Consumer Discretionary (mostly auto-makers, with the notable exception of Tesla) and Healthcare.
For the most part, the companies contained in the fund are solid, dull, well known companies with large market caps and relatively low margin but stable businesses.
However, it could be argued that many of these companies are also targets for the current wave of disruption - especially in Automaking (Tesla, EV startups, automated cars), Energy (Clean Energy) and Financials (FinTech) - but thats why they are in this Value index as opposed to a high growth fund.
Listings
This fund is available in a number of different combinations, and listing currencies:
IWFV = GBP Accumulation
IWVG = GBP Distributing (Potentially discontinuing)
IWVL = USD Accumulating
IWVU = USD Distributing (Potentially discontinuing)
You can choose to have either distributing (dividends are paid to you as income) or accumulating (dividends are added back to the fund to buy more shares). At the time of writing (March 2021), the distribution yield was just under 2%, although of course this is liable to change.
Annoyingly, Trading212 currently only lists the USD Accumulating share type, whereas FreeTrade has the GBP versions of both the distributing and accumulation funds. This is now more relevant given that Trading212 has introduced a small fee for transacting in currencies outside your base currency, so the presumption is you would incur a small fee if purchasing on the T212 platform as the only option is priced in dollars. This is why it is often worth having multiple accounts in order to cherry pick the best option.
Further Details

(Note these details are for the accumulation fund, but the distributing versions are also available).
An expense ratio of 0.30% is isn’t too bad considering the global nature of this fund, but given the stocks in the index are mostly liquid large cap stocks on developed exchanges, I feel this could be a tad lower.
It is worth noting that whilst the fund uses ‘Physical’ (i.e. it holds the underlying securities), rather than holding all the stocks which make up the underlying index exactly, it ‘Optimises’ to try and replicate the performance. This isn’t really of any concern to retail investors.
Summary
Overall, this fund provides a diverse mixture of solid and fairly unexciting value stocks. The performance of ‘value’ as an asset class has been poor for the past decade or so, with the focus being on growth companies (cynics would say growth companies grow everything except profits).
However, since the Covid Vaccine announcements in the Autumn of 2020, value stocks have performed strongly, and investors may feel that it is worth having specific exposure to this segment of the investing universe.
As ever, the above should not be construed as investment advice, and investors should conduct their own due diligence before purchasing.
In addition, whilst every attempt is made to ensure accurate and up to date information, fund information is liable to change and updates may not be reflected in existing articles.
If you would like to help support this service, you are welcome to sign up to either the Trading212 or Freetrade share trading apps - we’ll both receive a free share of up to £100 in value (but probably less!).
http://www.trading212.com/invite/FMcKXOcc
https://magic.freetrade.io/join/christopher/4390be64
At the time of writing, the author holds a small position in this ETF.
More here: https://www.msci.com/documents/10199/174e3915-2087-4c5b-815b-c1b7ea1ccbbf