


iShares MSCI World Small Cap ETF - Review
Who you calling 'Small'?

Next up, a look at an ETF which tracks the performance of (relatively) smaller companies across the world.
The iShares MSCI World Small Cap fund, is the larger of only two UCITs ETFs available to investors. It weighs in with around £2.7bn of total asset value, far larger than it’s rival from SDPR which only totals around £650m. In fact the size of this fund ranks it 8th of all World Equity ETFs according to JustETF.com.
So, what’s ‘Small Cap’ mean? The Cap part refers to market capitalisation (i.e. number of shares x share price) and ranges from the mega caps (for instance Apple, at greater than $2 trillion market cap) down to micro caps worth just a few million.
Clearly the ‘Small’ part is a relative term, but it is commonly accepted that it refers to companies with market caps between $300m - $2bn (which doesn’t really sound that small at all…!).
But what does this mean for our investing returns? Surely the big returns accrue to the largest companies in the market?
Well, there is ongoing debate regarding the outperformance (or otherwise) of Small Cap companies vs. the general market, or specific indices such as the S&P 500 or FTSE100.
This post attempts to dive into the question, and the answer seems to be that (in the USA at least), Small Caps outperformed Large Cap stocks by approx. 1% per annum, which although sounds small, does add up when compounding over decades. However, the article does note that there are periods when Small Cap performance diverges significantly from that of Large Caps.
To illustrate this, below is a simulated chart of the MSCI World Small Cap ETF vs. The Vanguard ‘All-World’ ETF1 from Feb 2005 onwards, showing the performance between the two.
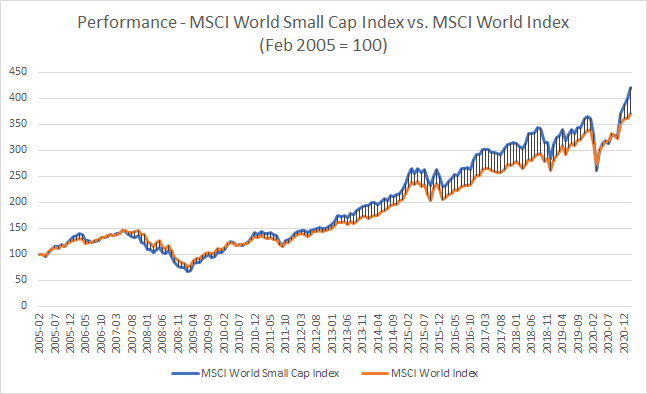
As of February 2021, the Small Cap fund was 13.7% ahead, despite a slightly higher management cost and for a compound annual growth rate of 9.39%.
Amending the starting date by a year or so does change the total return but not necessarily the ranking between the two - the outperformance of Small Caps from around 2013 to last March’s ‘Covid Crash’ is fairly clear to see.
However, on a smaller time frame, the situation is different, with two years of outperformance of the larger cap focused index, with Small Caps being particularly affected by the March 2020 ‘Covid Crash’ (although the gap has narrowed in recent months):

There doesn’t seem to be definitive agreement as to why Small Caps have periods of outperformance (or in some circles, whether they even do at all).
One theory is that smaller companies are more risky - perhaps they are exploring new business areas, or are focused on one particular niche and therefore suffer from a lack of diversification of revenues. This increased level of risk can lead to increased returns should business execution and economic conditions prove fertile. This should be rewarded by the market, and as the share prices may be starting from a lower base, enhanced returns may follow.
Another suggestion is that by virtue of their size, many companies simply do not get invested in by the biggest (and presumably more sophisticated investors) because the sheer size of the funds (say, Berkshire Hathaway for example) means that they would need to either purchase the entire company or take a huge stake in it to become just a sliver of the huge fund - a typical Warren Buffett stake would be in the billions of dollars - out of the Small Cap universe. Other funds are just limited by their underlying investment princples to invest only in companies of a certain size and liquidity.
This means that trade in these smaller company’s stocks may be lower than larger, more liquid companies and that could be a source of returns from smart investors looking for an edge.
So, in summary, it looks like there may be a small degree of outperformance for smaller companies over time, and this could provide some useful diversification for an investor’s longer term portfolio - however this cannot be taken for granted and as with any sub-asset class, there may be long periods of underperformance.
What’s In It?
Focusing back onto the ETF, and it is useful to go under the hood to understand what the current components of the fund are. Of course this may change over time, so it’s worth having a quick refresh if looking at this in the future.
As you’d expect from a ‘World’ ETF, there are a large number of holdings - just over 3,300 in fact - meaning that there is a strong diversification benefit as the fund avoids concentration on too few companies (*cough* iShares Clean Energy *cough*)

Similar to most ‘World’ indices, this ETF has a large exposure to companies listed in the USA - at just under 60%. Next we have Europe at 14%, Japan at 11% and the UK with 7%. Then there is a smattering of companies from other Developed Economies such as Australia, Singapore and Canada.
Therefore the title of ‘World’ is a little misleading, given it is really based on the market capitalisation of ‘Developed’ Market stockmarkets across the globe, rather than anything diversified across more countries or weighted by say, GDP per country rather than stock market capitalisation. There is an alternative index which includes Emerging Markets - the MSCI ACWI Small Cap Index.
(Interestingly there doesn’t seem to be a Small Cap ETF (listed in Europe at least) which includes Emerging Market economies. Watch this space?)
The index, and therefore the ETF is rebalanced quarterly.
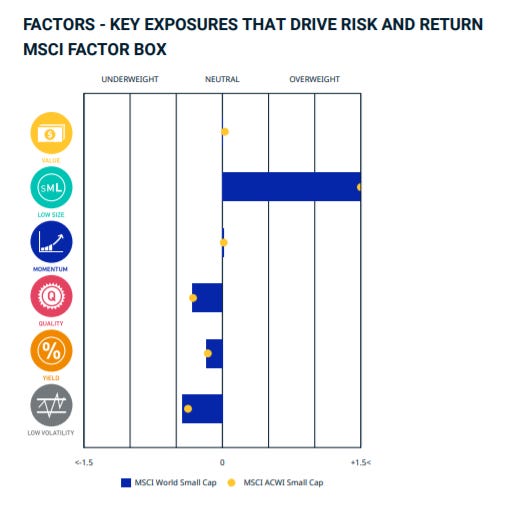
The following nifty chart from MSCI shows where the World Small Cap Index risk factors are located and compares vs. MSCI ACWI Small Cap Index (I.e. Developed Markets vs. All):2
Diving into the allocation by sector, and it is actually a fairly diversified ETF, with no sector having more than 19% of the fund - the largest being ‘Industrials’, which brings to mind huge factories spewing smoke into the sky but actually includes such household names as ‘Quanta Services Inc’ (“…the leading, end-to-end solutions provider in the electric power sector.”) and ‘Trex Inc’ (unfortunately not a prehistoric lizard, but actually a “…composite decking, railing & lighting companies”).

The two largest holdings are both gaming/gambling/casino companies in Penn National Gaming and Caesars Entertainment, which brings us neatly onto the fund’s ESG credentials.
Sustainability
A recent growing trend has been for investors to attempt to position their portfolios towards companies which have a more positive impact upon the world, and the investment world has sat up, listened and decided that it would like to supply a product which meets this demand.
This known as ‘ESG’ criteria - or Environmental, Social & Governance. I won’t go into detail here - feel free to Google around the topic - but suffice to say ETF providers now are starting to provide dedicated ESG ETFs for certain indexes, and for the ETFs which are not filtered for ESGness, they provide criteria scores.
As you’d expect with such a complex topic, there are numerous benchmarks and ratings etc. We’ll focus on the MSCI ESG Fund Rating3
For this ETF, the fund is rated ‘BBB’ and gains a ‘Quality’ score of 5.08 (out of 10), which places it mid-table, with just over 96% of its holdings having an ESG rating.
Valuation & Financials
As of end March 2021, the price / earnings ratio was 20.4, vs. 24.1 for a standard ‘All World’ tracker4
You could view this as Small Caps being ‘cheap’ compared to larger cap companies, or this could be reflective of the fact that the increased risks in holding smaller companies means that their price isn’t bid up by as much. Unfortunately I can’t seem to track down comparisons of the difference between the P/E ratios of the Small Cap Indices vs. Larger Cap ones - any pointers welcome in the comments section below.
The fund operates in ‘Accumulation’ mode - i.e. any dividends paid by the companies in which it has holdings are added back to the asset value of the fund and used to purchase further shareholdings (as opposed to being distributed to the holders of the ETF).
Other Considerations
In common with many ‘World’ ETFs, the fund’s base asset class is the USD, which means that UK or European investors will need to be conscious of the changes in their home currency vs. the US Dollar over time as this will impact returns over time.5
Fee wise, the fund charges a ‘TER’ of 0.35%, which generally in line with other products (SPDR Russell 2000 US Small Cap UCITS ETF charges 0.3% and SPDR MSCI World Small Cap UCITS ETF charges 0.45%), although higher than the larger, more liquid ETFs which focus on the main world indices (such as S&P 500 or FTSE100) and are generally below 0.1%.
Assets are physically purchased within this fund, meaning that the ETF ‘owns’ them, although as the fund is ‘Optimised’ it doesn’t exactly match the holdings of the underlying index, but instead purchases shares to try and track the performance of it.
In London, there are two listings - one in USD (WSML) and one in GBP (WLDS) - it shouldn’t matter which of the two you buy because as mentioned above, the base asset class is USD anyway. However, if you incur charges via your trading account for purchasing shares/funds listed in foreign currencies then you may wish to opt for the GBP option to avoid any additional fees (Trading212 is introducing such a fee in early April 20216

Summary
This fund provides relatively low cost exposure to a large investment universe of over 3,000 companies across the developed world, and in the past has exhibited a small degree of outperformance vs. a similar ‘All-World’ fund focused on companies with larger market caps - although as ever past performance etc etc.
It does have significant exposure to the USA (60%) and the US Dollar, which investors should take into consideration. In addition, the ‘World’ segment is slightly misleading as this fund focuses on the Developed World.
—————————————————————
As ever, the above should not be construed as investment advice, and investors should conduct their own due diligence before purchasing.
In addition, whilst every attempt is made to ensure accurate and up to date information, fund information is liable to change and updates may not be reflected in existing articles.
If you would like to help support this service, you are welcome to sign up to either the Trading212 or Freetrade share trading apps - we’ll both receive a free share of up to £100 in value (but probably less!).
http://www.trading212.com/invite/FMcKXOcc
https://magic.freetrade.io/join/christopher/4390be64
The actual ETFs were not available in 2005, so the performance of the underlying MSCI indices, (less the current TER charges) per ETF has been simulated. See: https://backtest.curvo.eu/
https://www.msci.com/documents/10199/2cdf9672-e1b2-4197-a951-9605fce4772f
Further detail available here: https://www.msci.com/our-solutions/esg-investing/esg-ratings/esg-fund-ratings
Vanguard All-World Tracker in this instance: https://www.vanguardinvestor.co.uk/investments/vanguard-ftse-all-world-ucits-etf-usd-distributing/portfolio-data